Geographic Information System (GIS) and remote sensing in agriculture stop being a slideshow and start driving decisions the moment you treat satellite, drone and ground data as one fused stack rather than three separate maps. Satellites give you cheap, frequent, field-scale context; drones give you on-demand centimeters over a few hectares; ground sensors give you truth. The skill is combining them at the right level: pixel, feature, or decision. The cheap, frequent layer decides where to look, and the expensive, detailed layers decide what to do. You do not fly the whole farm with a drone. You let Sentinel-2 tell you which 10 hectares are worth the flight.
This is for agronomists and geospatial engineers who already pull Normalized Difference Vegetation Index (NDVI) tiles and fly the odd drone mission, and want the multi-source pipeline that actually changes a nitrogen or irrigation call mid-season.
The three layers, and what each is good at
Every operational agriculture stack draws on three acquisition tiers. They are not interchangeable; they are complementary, and each covers the others’ blind spots.
- Satellite is the context layer: wide, repeating, free or cheap. Sentinel-2 images at 10 m in the visible and near-infrared with a 290 km swath and a 5-day revisit from the two-satellite constellation (European Space Agency (ESA)/Copernicus). Landsat 8/9 adds a 30 m, 16-day record (8 days combined) with a long archive (United States Geological Survey (USGS)). Great for whole-farm trends, poor for a 3 m weed patch.
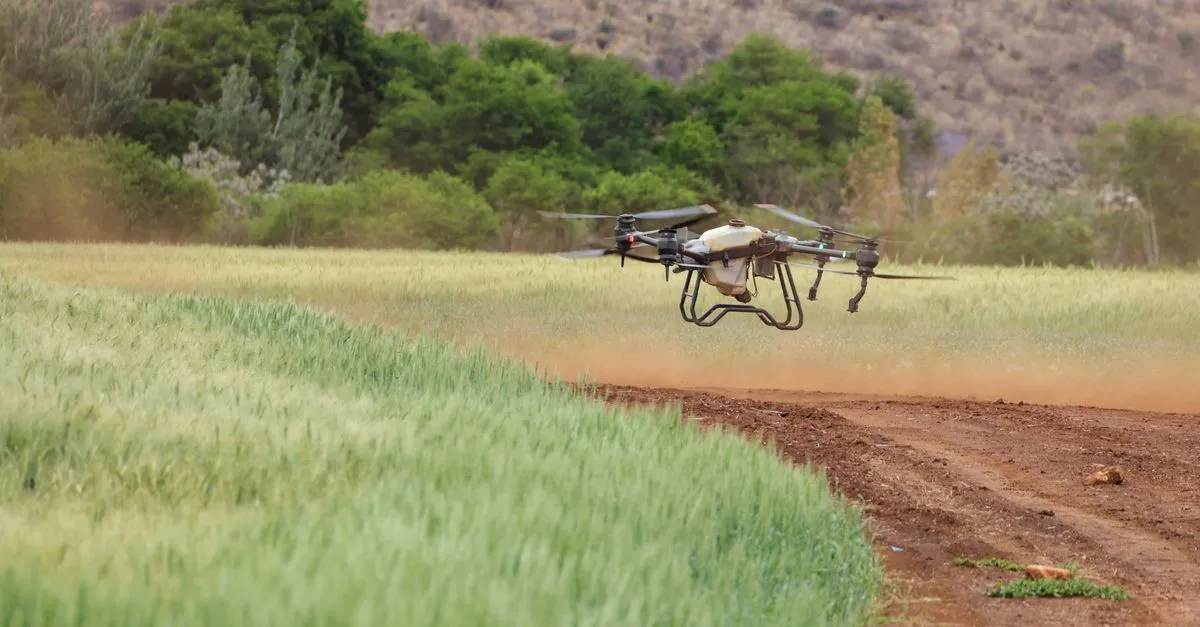
- Drone is the detail layer: centimeter ground sample distance, flown when you decide, but only over the hectares you cover that day. Frontiers in Remote Sensing (2025) puts Unmanned Aircraft System (UAS) spatial resolution at roughly 3 mm to 1.86 m, against 31 cm to 60 m for satellites. The trade is obvious: detail for footprint and effort.
- Ground is the truth layer: soil probes, tissue tests, yield monitors, hand samples. Low spatial coverage, high certainty. This is what calibrates and validates everything above it.
Put the numbers side by side, because the trade-offs are the whole point:
| Layer | Resolution (Ground Sample Distance, GSD) | Revisit | Footprint | Cost | Role |
|---|---|---|---|---|---|
| Satellite (Sentinel-2) | 10 m | ~5 days (cloud permitting) | Whole farm/region | Free | Context, trend, anomaly flag |
| Satellite (Landsat 8/9) | 30 m | 8 to 16 days | Whole farm/region | Free | Long archive, change detection |
| Drone (Unmanned Aerial Vehicle, UAV, multispectral) | ~1 to 10 cm | On demand | A few to tens of hectares | Crew + flight time | Detail, diagnosis, calibration |
| Ground sensors/sampling | Point | Continuous to per-visit | Points | Labor + hardware | Truth, validation, root cause |
How GIS and remote sensing actually combine in agriculture
Remote sensing captures the signal; GIS is the spatial backbone that registers, stores, analyzes and turns it into a controller-ready prescription. The interesting question is not “do they work together” (every vendor says yes) but at what level you fuse the data. The research literature is clear that fusion happens at three distinct levels, and they are not equally common or equally accurate.
Pixel-level (data-level) fusion
You resample and co-register the sources onto a common grid and combine the actual reflectance values, for example sharpening a coarse satellite time series with a drone flight, or blending Sentinel-2 with higher-resolution imagery. A 2025 Frontiers in Remote Sensing review found pixel-based methods dominate the UAS-satellite fusion literature at about 70% of studies and delivered the highest average classification accuracy, near 90%. It is the most powerful and the most demanding: registration error and radiometric mismatch go straight into your result.
Feature-level fusion
You derive features first (indices, textures, object boundaries, zones) from each source, then combine those. The same review found feature-based fusion the rarest at roughly 7%. It is more forgiving of small misregistration than pixel fusion and useful when sources are too different to blend raw.
Decision-level fusion
Each source produces its own answer (its own stress map or classification), and you combine the decisions, by voting, rules, or agronomist judgment. About 23% of studies took this route. It is the most robust to sensor differences and the easiest to reason about, which is why it is often where operational systems land even when pixel fusion scores higher in a paper.
The practical reading: pixel fusion when you have tight co-registration and calibrated reflectance; decision fusion when you do not and need something that survives messy inputs.
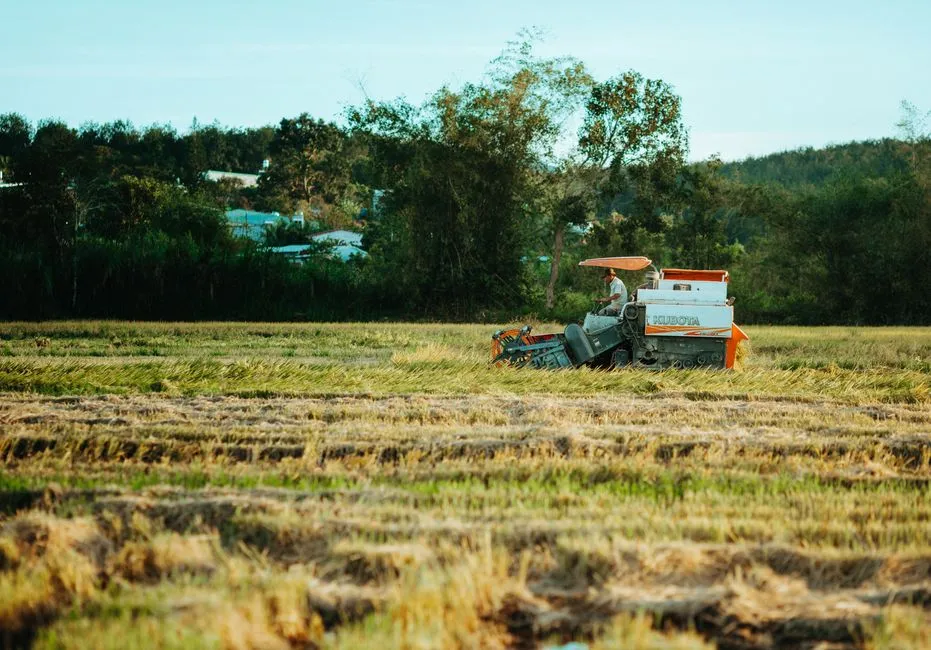 Yield monitors on harvest machinery close the loop: the ground-truth layer that calibrates every index above it. Photo by Thái Trường Giang on Pexels.
Matching resolution and revisit to the decision
Pick the source by the decision, not the other way around. Ohio State University Extension makes the operational point plainly: in-season choices like nutrient application and irrigation scheduling need imagery at frequent intervals through the growing season, and spatial resolution has to be fine enough to resolve the feature you care about. A 0.25 m pixel reveals variability a 10 m pixel averages away.
So map the decision to the layer:
- Whole-field trend, zone delineation, anomaly flagging: satellite at 10 to 30 m, every few days. Cheap and frequent wins.
- Diagnosing a flagged anomaly, weed or disease patch, replant decision: drone at centimeters, flown on the day you need it.
- Confirming root cause, calibrating an index to a unit (kg N/ha, soil moisture): ground sampling.
From multi-source data to an in-season decision
Here is the cascade you should run it:
- Sentinel-2 flags an anomaly. A 10 m Normalized Difference Red Edge (NDRE) or NDVI tile shows a zone trending down relative to the rest of the field. Coarse, but it is free and it arrived this week.
- A drone resolves it. You task a multispectral flight over that zone at a few centimeters. Now you can see whether it is a drainage line, a weed patch, a nutrient stripe or a sprayer miss, distinctions the 10 m pixel buried.
- Ground sampling confirms cause. Tissue or soil tests on the worst sub-zones turn a pattern into a diagnosis, and calibrate the index to a real unit.
- GIS writes the prescription. The fused result becomes management zones and a variable-rate map your controller can execute, tied to a coordinate reference system and your machine’s guidance.
The same review notes that high-resolution UAS data can serve as ground truth for validating and calibrating satellite data, which is the other direction of the same loop: the drone and ground layers do not just diagnose, they make next month’s satellite read more trustworthy.
Where fusion breaks
The honest pitfalls, because this is where projects fail:
- Co-registration. Pixel fusion is unforgiving. A half-pixel shift between a drone orthomosaic and a Sentinel-2 tile smears boundaries and invents variability. Budget for accurate georeferencing (Real-Time Kinematic (RTK) on the drone).
- Radiometric mismatch. Different sensors, illumination and view angles mean reflectance does not line up across sources. Without surface-reflectance correction and bandpass awareness, you are fusing apples and oranges.
- Timing. A satellite pass and a drone flight three cloudy weeks apart are not the same crop. Fusion assumes near-coincident acquisition; clouds routinely break that assumption.
- Garbage zones from saturated indices. If the satellite layer is mid-season NDVI in a closed canopy, the anomaly it flags may be noise. Match the index to the growth stage before you trust the flag.
Get those four right and GIS and remote sensing in agriculture stop being a gallery of pretty maps and start being a decision system.
Key takeaways:
- Three complementary layers, not three maps. Satellite gives cheap, frequent context, drone gives on-demand centimeters, and ground sensors give truth; each covers the others’ blind spots.
- Fuse at the right level. Pixel-level fusion is most common and most accurate (near 90%) but unforgiving on co-registration; decision-level fusion is the robust choice when inputs are messy.
- Pick the source by the decision. Match resolution and revisit to the smallest feature you must act on: satellite for whole-field trends, drone for diagnosis, ground for calibration.
- Run it as a cascade. Let a free Sentinel-2 pass flag where to look, task a drone to resolve it, confirm cause with ground sampling, then let GIS write the variable-rate prescription.
- Mind the four failure modes. Co-registration error, radiometric mismatch, acquisition timing and saturated indices are where fusion quietly breaks.
Frequently asked questions
What is the difference between remote sensing and GIS in agriculture?
Remote sensing is the measurement: sensors on satellites, drones or aircraft capturing reflectance over a field without contact. GIS is the spatial system that stores, registers, analyzes and visualizes that data alongside soil, yield and boundary layers, and turns it into management zones and prescription maps. Remote sensing produces the signal; GIS turns it into a georeferenced decision.
How are remote sensing and GIS used together in precision agriculture?
Remote sensing supplies repeated imagery and vegetation indices; GIS co-registers those with soil, yield and topography layers, delineates management zones, and exports variable-rate prescriptions to machine controllers. The loop closes when ground and yield data flow back into GIS to calibrate the next round of imagery. The two are halves of one pipeline, not separate tools.
What is the best satellite resolution for crop monitoring?
It depends on the decision. For whole-field trends and zoning, Sentinel-2 at 10 m every few days is usually enough and free. For sub-field features like weed patches or narrow stress stripes, 10 m averages them away and you need drone imagery at centimeters or tasked commercial satellites at sub-meter. Match resolution to the smallest feature you must act on.
Satellite vs drone imagery for agriculture: which is better?
Neither alone. Satellites give frequent, cheap, whole-farm coverage but coarse pixels. Drones give centimeter detail on demand but only over small areas and with crew effort. The operational answer is to fuse them: let satellites flag where to look, then fly drones to diagnose. Ground sampling validates both.
How often should I get satellite or drone images during the season?
For in-season nutrient and irrigation decisions, extension guidance is to acquire imagery frequently through the growing season, not once. Sentinel-2’s 5-day revisit is the free baseline, though clouds cut the usable cadence. Drones fill the gaps on demand when a decision cannot wait for a clear satellite pass.
What is data fusion in precision agriculture?
Combining multiple data sources (satellite, drone, ground, weather) into a single, more informative product. It happens at three levels: pixel-level blends raw reflectance on a common grid, feature-level combines derived indices or zones, and decision-level merges each source’s separate output. Pixel fusion is most common and most accurate but most demanding on co-registration.
How do you turn remote sensing data into a fertilizer or irrigation decision?
Flag an anomaly with frequent satellite imagery, resolve it with a drone flight at centimeters, confirm the cause with ground sampling, then use GIS to convert the fused result into management zones and a variable-rate prescription tied to your guidance system. The imagery sets where and how much; ground truth keeps the units honest.
How accurate is fused satellite and drone monitoring?
In published UAS-satellite fusion studies, pixel-level methods reached around 90% average classification accuracy, higher than feature or decision-level approaches. Real-field accuracy depends heavily on co-registration, radiometric correction and how near-coincident the acquisitions are. Treat published figures as a ceiling and validate against your own ground data.
Sources and further reading
- ESA/Copernicus, Sentinel-2 mission specifications (SentiWiki)
- USGS, Landsat 9 mission and revisit
- Frontiers in Remote Sensing (2025), UAS and satellite data fusion for agriculture
- Ohio State University Extension, Remote sensing for precision agriculture (FABE-5541)
- USDA NASS, Cropland Data Layer (Landsat + Sentinel-2, 30 m to 10 m in 2024)
Resolution, revisit and accuracy figures are representative as of June 2026 and vary with sensor, processing and cloud cover; validate against local ground truth before acting on a prescription.